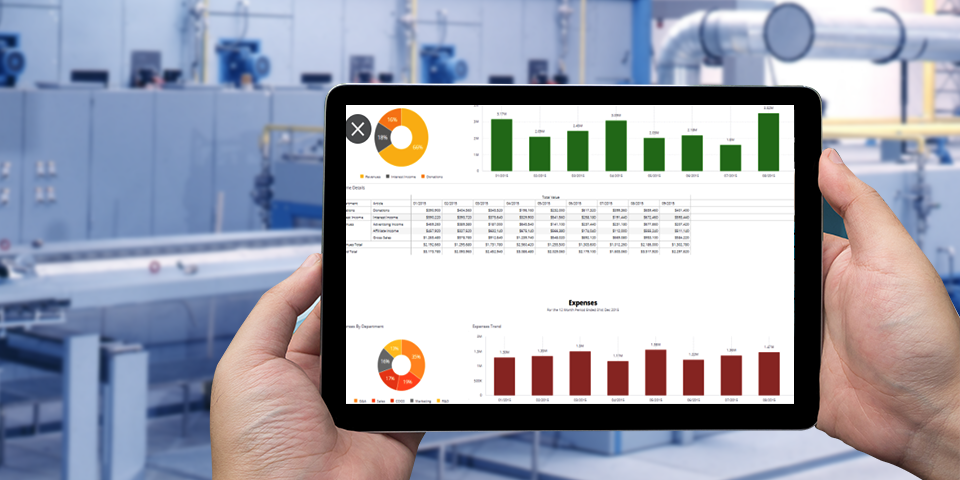
A Japanese multinational company has a workforce of about 12,500 in India. Using Analytics, the company has deepened it’s knowledge of Key Performance Indicators of various manufacturing sectors and employee performance across the entire organization in India. The insights gained have helped the stakeholders improve areas of the business such as Revenue targets, employees’ scorecard evaluation, spare parts product filtering and services.
Challenges

In India the company uses Profit and Loss reports to know the expense allocation on various heads through General Ledger(GL) data and expense data separately. A product hierarchy is maintained which includes rows like product center, product sub-group, segment and module. They all are further combined with categories like Trade partner, Branch and Sales channel one by one till the expense head is determined for the product picked for P&L Analysis. The combination and permutations are such, say a product from ‘module’ is picked and combined with ‘sales channel’ through a logic to give out it’s overall expense head, if the expense head is not determined at ‘sales channel’ then the set of combination shifts to ‘module and segment’, so on.
The key IT challenges the company faced while implementing this intelligence are:
- Manual Preparation of Reports
- Time lag in Report Preparation
- No insights into current operations
- One handler, many point of contacts
- Data in Silos
These IT challenges percolated down to their business performance as well due to delayed delivery of P&L reports at the end of the Month. Limited number of logics for quantification of reports and less accuracy on expense head failed to give the true picture of the P&L status.
What did we do?

With the help of Analytics we provided the company with main 11 Dashboards – PL Automation being a huge success.
- These Dashboards provide Business Insights in an integrated and compiled format,data is collected from multiple sources and integrated together.
- The reports are now easy to understand since all the information is clearly visible in the form of charts and graphs, as compared to the huge excel reports earlier.
- Reports are shared with all the employees in the organisation irrespective of their departments, in time. The dashboards have enabled the employees to co-relate multiple business reports at a time and make quality decisions faster.
- The dashboards prepare reports that are completely automated and do not require any human effort.
- The Dashboards have helped to increase the accuracy of numbers while calculating expense heads in P&L Reports significantly.
- Executive Dashboard for the CEO on a mobile app that has reports refreshed in every 3 hours. Giving a near real time look and feel to the dashboards.
How did P&L Automation Help the Japanese multinational?
The company was very impressed by our deliverables and enjoying the user friendly Dashboards.
- They have seen a significant amount of increase in the accuracy of expense heads calculated from P&L reports after automation.
- Level of logics used to calculate the expense heads has increased from 4 logics to 16 logics, i.e the accuracy of determining the profit making of products or services has increased 4 times than earlier.
- Earlier they had an expense head calculated through P&L determination of 8 product(90 yo 95% determination) per month from company’s division(CSD) but now it’s done for all products (100% determination)
- PL reports are calculating operating profit [Revenue(Total sales) – Expense(like salary, marketing expense etc)
- The time lag of report generation has reduced from 30 Days to approximately 19 days.
